

Post Pandemic, Post Ukraine Conflict Challenges And Opportunities
Authors: Richard Simmons, University of Hertfordshire UK;
Professor Nigel Culkin, University of Hertfordshire UK
Dr Virginia Davies
Abstract:
Experiences arising from recent geo-political tensions, natural disasters such as the 2011 Japanese Tōhoku Earthquake, the Covid-19 Pandemic and the 2022 Russo – Ukrainian war have all illustrated the fragility of the global supply chains to exogenous shocks. Shocks always occur, but the combination of global political tension and climate change events suggest that alternative supply chain designs maybe more appropriate for stress (sometime called “crisis”) situations than building ever increasing amounts of safety stock. Some firms have already started to “reshore” remote operations and 3D printing will offer other reconfiguration possibilities.
This paper looks at a third “market friendly” alternative that builds upon existing cluster innovation links to grow supply chain resilience in Tier 2 and Tier 3 suppliers within existing clusters by expanding the scope of their cluster membership to “pool” their resources to ensure continuity of supply. The paper draws on a wide variety of disciplines to propose a cluster resilience framework that can be activated in times of stress. The resilience framework draws upon member firm expertise to drive it and is thereby market focused whilst defending the competitive position of the cluster as a whole. In non-stress times, these firms both compete for customers and collaborate on innovation so such a framework needs to be enabled and administered by a neutral player, and for this we propose a local “entrepreneurial university” to anchor the institutional machinery to build the “thick trust” that enables partnership to drive both supply chain resilience and enhanced innovation.
Introduction
Supply Chains, Clusters, Crisis and Growth
Since 1980 globalisation has been typified by high rates of product introduction, low inflation, reliable and geographically dispersed and complex supply chains driven by large multinational firms. Up to 2018 these global supply chains succeeded in providing consumers with an unrivalled range of products whilst also reducing inflation to an almost negligible level (Andrews, Gal & Witheridge, 2018). Bright new products and technologies were spawned by a variety of innovative clusters such as in Silicon Valley.
Concurrent to the integration of global supply chains, areas of specialisation and excellence have developed in specific regions. These have become known as “Clusters”. Whether the cluster is in “Silicon Valley” (for high technology), Baden Württemberg (for precision automotive), or “Guangdong” (for apparel), successful clusters exhibit common features that include a vibrant, competitive and innovating SME sector that is exporting outside its own geographic area. The “openness” inherent in cluster-enabled cross-firm networking, plus integration into global markets, combine with more conventional business factors to provide significant impetus to drive up SME innovation rates (Love & Roper, 2015). Raising SME innovation and exporting capability is often associated with growth business success.
Clusters successfully allow smaller (and often more innovative) firms to work with each other to develop new and ideas and products (Park et al., 2012) that then often innovate existing and, develop and open new markets. In non-stressed environments, clusters such as Silicon Valley allow smaller firms to work collaboratively in an “open innovation model” to develop new products. This style of work is recognised as a key success factor to driving up SME innovation rates (Kumar et al., 2012).
Since 2008, firms have faced multiple challenges and stress, first through the 2008 global financial crisis, then through the Trump trade policies and subsequent global trade fragmentation, followed by the Covid-19 Pandemic, extreme climate events and natural disasters and then the Ukraine war. Each set of events has “stressed” supply chains, sometimes to where they fail and sometimes to where that flex and recover.
Whilst history is the best determinant of what was a “stress” event, any “forward looking” assessment is necessarily qualitative rather than quantitative. These assessments depend upon “expectations” of what will occur, so that action can mitigate the worst impacts. Whilst data reflecting items such as backorder rates on key suppliers, and local inventories can be important input into such a decision, we argue that the declaration of a “stress event” needs to be made jointly by both the cluster and its major customers, as both supplier and customer buy-in are essential to accepting short term “pooled working”.
Consequently, this paper proposes that existing cluster-wide co-operation on innovation is extended to establish a customer facing, and therefore market driven, cluster resilience framework. The nub of this proposal is to have a cluster-wide virtual “super-firm” that can integrate the master production schedule across the cluster as a whole during times of supply stress, thereby optimising the use of scarce inventory and associated production capacity to assure customer deliveries. Firms collaborate to protect the cluster, but continue to compete to drive their long term product, cash and profit trajectories.
The commercial aspect is maintained by a combination of “Co-opting” resources from cluster based firms into the virtual super-firm for short periods of time (so each firm has “their” person in the virtual firm) and supervising and governing the super – firm from a commercially neutral institution such as the local university. Firms have a strong financial and reputational incentive to participate in a “stressed situation pool” as “assuring supply continuity” during major periods of supply stress offers significant customer benefits over competing supplier offers. Further, once established, the contingency arrangements have minimal background running cost, so offer firms a highly attractive “non price”, “non profit margin eroding” competitive differentiator.
Pre-Pandemic Status Quo
Starting in the 1980’s, but becoming widespread from the 1990’s, many multinational organisations up until the 2020’s focused upon supply chain optimisation, defined as meeting customer needs whilst driving a combination of constantly reducing prices and assured availability, in a cost-effective manner (Min et al., 2019). These developments drew upon the post 1980 institutional setting of “western commerce” and its increasingly, (if only partially) liberalised markets (Kozul-Wright., & Rayment, 2004). Global supply chain developments utilized advances in systems, communications and computing power over this period to allow for all activities across the firm’s global supply chain to be integrated into a single picture, so that sell out rates and inventory holdings could be optimised against the unit landed costs available from individual supply sources.
For Multi National Corporations, operating profit margin assurance became more certain as the landed cost calculation itself became easier to predict, as tariffs were rolled back and financial system products, such as interest rate and currency hedges plus low global inflation rates, allowed multinationals to plan both costs and supply on a medium term (six to twelve months) basis. For example, the purchase of a currency hedge, through the use of currency options can assure a locked in currency rate for the duration of a supply contract, so the local currency landed cost for that item is a known fixed amount for a known period (Ding et al., 2007). The remaining significant cost variable (assuming no changes to taxation) in the immediate term is demand related, as to whether to use airfreight (at more cost) as opposed to using sea freight (at lower cost) if there is unexpected customer demand or a failure in the logistics chain (Feller, 2008). A well-planned supply chain should be able to avoid freight emergencies, so with hedged purchases and predictable tariffs and trade duties, prices could be fixed for significant periods of time, all contributing to the post-1990 fall back in global inflation rates.
Rolling Forecasts and Annual Budgets
Concurrent with these changes, operational decisions were separated from financial budgets, as from the 1980’s demand forecasting was significantly decoupled from annual budgeting (it was always only loosely connected) by the adoption of rolling forecast approaches (Sahin et al., 2013). Whilst retaining tight financial control by enabling variance reporting against budget, these allow (often on a global supply chain into East Asia) a certain (often two or three month) fixed “production” window before product shipment for demand followed by variable amounts of “adjustability” in demand for production windows. The adjustment constraints are set in recognition of capacity limitations and the availability of critical components. Flexibility is enhanced by tier 2 and tier 3 component suppliers, even if they are competitors, having a high degree of interaction with each other as well as with their customers (Kisperska-Moron & Swierczek, 2009).
In essence, Tier 2 and Tier 3 suppliers provide an “agile” resource that can adapt quickly to changes in demand from the next tier and the ultimate Tier 1 or OEM customer, not least as plant level production schedules are fixed on a shorter time frame than the rolling forecast window, allowing further flexibility in output configuration provided there are enough components to “tweak” the schedule. Innovation across the supply chain is also greatly enhanced by good communication between firms “horizontally” across the supply chain (Buchmann & Pyka, 2015).
Everything within this framework has become increasingly “systems” driven (Bughin et al., 2016). Each product has a bill of material that sets out its component and sub-assembly composition, and in turn each of these has a parts and subassembly requirement, all with stated lead times and anticipated quality approval rates. As production rolls, the actual deliveries and actual failure rates are measured against targets and supply chain manager intervention only occurs when things are going wrong.
Shocks and Safety Stock
As just described, this is a stable system that carries additional inventory at each stage to deal with the statistically predicted demand variability and supplier performance. Improved “efficiency” arises by reducing the size of the standard deviations against median demand (to minimise supply chain noise). As a practitioner’s rule of thumb, provisioning to within two standard deviations off the median is often used to maintain a 99% customer order fulfilment rate and take into account short term demand noise across the supply chain. The median itself changes over time and the curve to determine it can be either seasonally or dynamically predicted based upon the statistical analysis of prior behaviour. The build-up of this forecast curve (moving average, polynomial etc) is different for each different type of product market.
Risks and shocks are also magnified by the number and complexity of information linkages across all tiers in a supply chain. Although a top tier OEM manufacturer may look to protect supply chain operation through multi sourcing, such approaches do not automatically ripple down through all of the tiers of the supply chain, leaving the possibility for there to be “hidden” weaknesses where a critical part is ultimately sourced from a single vendor (Kidd, 2019). For example, although there are many makers of N95 type personal protection masks, there is only one firm globally that has the patents and know how to make the machines that make the cloth that N95 masks are made from.
Supply Chain Stress Response
In the event of an unexpected demand change (either up or down) the supply chain manager’s interventions are prioritised according to the business setting at that moment in time. The top priority in the event of a downturn in demand is to control the “value at risk” by managing working capital via focusing upon the most expensive components and how their purchase can be slowed. By juxtaposition, in a shortage the priority changes. Maintaining customer fulfilment takes priority with the focus moving to “what are the longest lead time, (often custom) items” and how can their purchase be accelerated. Such decisions are made in the context of product budgets, with some consideration being given as to what the inventory holding costs are for purchasing critical component items in higher batch sizes.
For example, an ASIC custom computer chip with proprietary logic may cost relatively little against the cost of the final product, yet it is impossible to obtain on an immediate purchase as it is custom- manufactured and must have a production slot in the chip foundry. Final product schedule decisions in this type of product market can sometimes become a decision on the purchase batch quantity for critical items. Such dilemmas can create tension between the supply chain manager and the finance function. Assured supply always comes at a price, and a key organisational decision is to establish the correct trade off between the two. By definition, anything that softens this trade off has significant potential to raise both firm level performance and reduce working capital and associated inventory costs.
Such planning normally takes place within a reasonably stable macroeconomic paradigm (tomorrow feels rather like today) and is only programmed to handle a limited degree of external shock. The degree to which an external event becomes a “Black Swan” event (Taleb, 2007) is related to how comprehensive and realistic the occurrence probability for the combination of explicit and implicit disrupting events is (Marsden, 2017). This in turn reflects the balance of the “in firm” negotiation between the various functions of the company. Operating efficiency is optimised when this balance takes into account “normal” disrupting events, which can be defined as events that have a probability of occurrence of say once every ten years or greater.
High Intensity Multi-Shock Impact
The period 2020 to 2022 has seen multiple shocks to global trade. The main three are highlighted here, although longer term the threats from disruptive climate change related events are, likely to be even more material. Here we highlight the impact of the Covid-19 Pandemic, blockage of the Suez Canal and the Ukraine War.
Pandemic
The Covid 19 Pandemic had a deep impact on global supply chains and is expected to see considerable structural change (Komorowski et al., 2021). First lock downs, then changes in customer demand profiles and then a blockage in the Suez Canal, all of these have led to strains in today’s supply chain model.
Part of the solution to these strains has been to increase the use of airfreight to ensure product availability, and part has been to limit the ranges available to customers, whilst some manufacturers have reconfigured their production. Perhaps the most dramatic and detailed exposure to the fears of full supply chain disruption came during the 2022 Canadian Truckers protest that blocked the Ambassador Bridge between Canada and the United States. This bridge is a key trucking gateway for automotive industry parts to traverse the border as Tier 1 and Tier 2 suppliers prepare assemblies for the car manufacturer OEM’s (Domonoske, 2022). Although the disruption only lasted a week, it led to the closure of assembly plants as far away as Kansas.
Suez Canal
The six-day 2021 blockage of the Suez Canal amplified tensions in already “Pandemic Stretched” supply chains as it blocked a major shipping thoroughfare between East Asia and Europe (Oxford Analytica, 2022). This route carries 60% of Chinese goods shipped to the EU, with the stoppage interrupting US$9 billion of trade. The current feasible non- air alternatives to this route are the Trans-Siberian railway which passes through Russia, and future options will include opening an Arctic Sea route, which again passes by Russia (Imamkulieva, E., & Kondakova, 2022). Cost and capacity constraints limit the feasibility of air as an alternative bulk shipment route.
Ukraine Invasion & Conflict
The February 2022 Russian invasion of Ukraine and subsequent Ukraine war have resulted in both the disruption of Ukrainian supply into the EU and the commercial isolation of Russia from the EU and USA via a series of sanctions measures. With the exception of Russia’s crucial energy trade, these sanctions are argued to have cut Russia’s links to the Western Trading system and led to the serial departure of Western multinationals (Deuber, 2022). Notably these sanctions have not at the time of writing impacted Russia trade with China and India. Pakistan and a number of other countries across the globe such as the Gulf States and South Africa have also ignored the call to abide by sanctions.
Russia is thereby adjusting its trading links to the new situation as are the EU, Anglosphere, South Korea and Japan. Notably, East Asian emerging economies such as Indonesia and Vietnam have no plans to implement sanctions on Russia (Tass, 2022a & 2022b). This situation is dynamic as the USA and its allies are implying a threat to sanction third countries that help Russia break US sanctions (White House, 2022) and all dollar payments to Russia are impacted via financial system sanctions. Equally, the western nations are adjusting their trading links to isolate Russia. For western nations, with the exception of energy, certain “rare earth” minerals and a limited number of products such as fertilisers and aluminium, the focus is upon withdrawal from Russia rather than existing supply chain adaptation.
Estimated Impact
Overall, globally it is estimated that the Covid-19 Pandemic and Suez Canal closure will have cost US$18 trillion over the period 2020 – 22 or 20% of global GDP (Jackson et al., 2021). Such a sizeable shock was inevitably greater than the safety margins built into supply chains. Chart 1 below shows changes in retail inventory holdings relative to retail sales for business in the USA during the period since the 2020 start of the Pandemic contrasted against the average retail inventory holding in the 10 years prior to the Pandemic.

Chart 1 USA Inventory Sales Ratio (US Census Bureau, 2022a)
The initial uptick in inventories was due to falls in retails sales consequent upon Pandemic related lockdowns. Subsequently, in the face of restricted supplies, as retail inventories have fallen, stock outs and product availability issues have risen. Sample data from products representing the bulk of consumer products suggest stockouts rose from a pre pandemic 14% of stocked lines to a peak 35%, falling back to about 30% in May 2021 (Cavallo & Krystov, 2022).
At the same time manufacturers and traders sought to adjust the supply chain to mitigate the product shortages, by increasing the inventory on hand as seen in Chart 2 below.
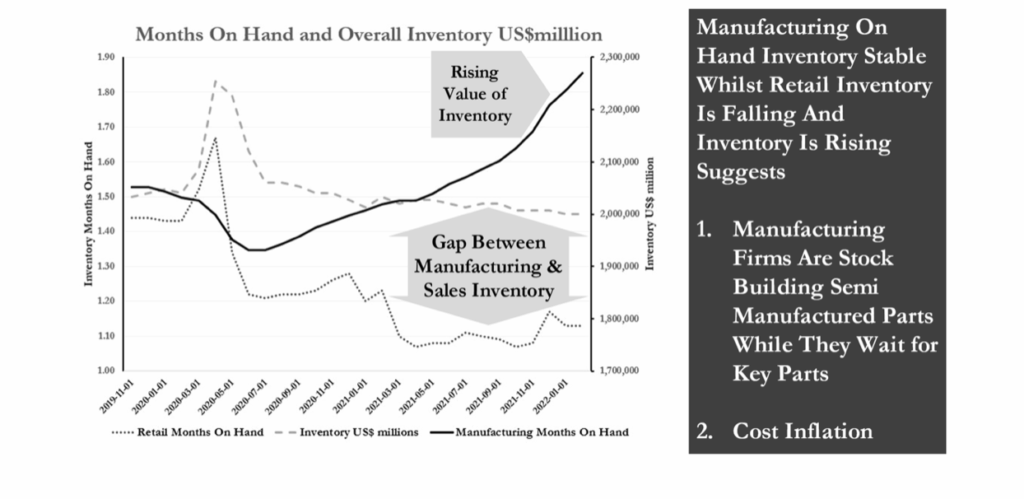
Chart 2: United States Sales & Manufacturing Inventories (US Census Bureau, 2022a)
With retail sales running at around US$550billion per month (US Census Bureau, 2022b), the fall in inventories represents about US$165billion of lost or delayed sales to manufacturers, who have concurrently funded about US$500 billion of incremental inventory over the pandemic (US Census Bureau, 2022a). Retail industries have reduced inventory, whilst supplier inventory is bottlenecked by either component shortages or held in port and distribution congestion. When supply impediments finally dissipate, it is likely that there will be an overall excess of inventory in the system, leading to restrictions on orders, falling demand and a significant “Bull Whip” effect we discuss later.
In summary, both the Pandemic and Suez Canal closure significantly disrupted both production and logistics, leading to rises in the overall US$ value of inventory holdings at the same time as falling customer order fulfilment due to stock – outs. Both metrics are features of a supply chain facing shocks that it cannot compensate for, that is “Black Swan” (Taleb, 2007) events that require a different approach to re-establish stability.
At the time of writing it is not possible to estimate the impact of the Ukraine war, although it would be no surprise if, for the European Union, it were to be as significant as the Pandemic.
Supply Chain Reorientation
Both Covid 19 and the Ukraine war have had, and are continuing to have, deeper and longer lasting supply chain impacts than the Suez Canal closure and the Canadian trucker protest. These impacts are in some way less obvious because, on the whole, global supply chains were (despite short term stock outs) surprisingly resilient to the immediate shock, with the notable exception of the supply of masks and personal protective equipment. The demand for this type of product exploded overnight, and, especially for high quality respirator masks, supply was dependent upon a supply of material which in turn was dependent upon a single global manufacturer of the machines that make it.
“Single threading” is also true of custom chips used in automotive manufacture, where the specialist nature of the product meant that there are only a very limited number of supply sources globally. All of these suppliers were already running at full capacity and could not handle an immediate large increase in production. The lack of a low-cost part led to the stopping of entire assembly lines globally and will lead to a change in the stocking policy for this item with more safety stock being held (Fazili & Harrell, 2021). A strategy to tackle supply chain resilience necessarily requires assuring enhanced diversity of supply for critical components.
Tactical Short and Medium Term Changes
The combination of the Pandemic and the Ukrainian war are creating widespread shortages, often of base inputs and components. For example, the European gas price led to the shuttering of some fertilizer plant capacity which in turn reduced the supply of commercial carbon dioxide and led to a crisis in the abattoir and meat packing industries as insufficient carbon dioxide was available to kill livestock (Davy, 2021). Short term adaptation to large scale and medium term disruption can initially be managed through increasing safety stocks at each distribution point (central and regional) within the supply chain network (this increases supply chain “flex”). At the end of the supply “stress” event safety stocks will need to be “reset” to “normal” levels across the supply chain by the cancellation re-establishment of outstanding orders. This will ensure that such short term increases in orders are not interpreted as permanent future increases in demand that would lead to excess production that then result in a “bull whip” oversupply stop – go situation as supply chains seek to adjust through an oscillation of “feast and famine” in purchase and production orders (Rozhkov et al., 2022).
Increasing safety stocks is a valid mitigation strategy in “one off” settings, but is questionable in situations of multiple disruptions that are combined with structural shifts in demand. Such situations are likely to require an alternative approach.
Long Term Strategic Changes
Arguably, post March 2022 a structural shift in both demand and supply chain configuration became inevitable due to the disruption arising from the Pandemic, shifts in customer demand resulting from the Pandemic and disruption from the Ukraine war. These are causing a “step shift” in thinking as to how supply chains should be managed, with companies expected to move production back closer to customer markets (Agnew, 2022). They are being driven by the substantial “value at risk” individual firms risk that is especially concentrated in industries such as electronics, textiles and to a degree automotive. (Lund et al., 2020).
Reconfiguration requires that supply chains be understood according to their multiple tiers and the interrelation between each tier. Multi-tier holistic management is challenging in stable times, let alone when there is rapid structural shift in both operational frameworks (in response to the Pandemic and sanctions) and product innovation and disruption such as the move to electric vehicles in the automotive industry. Adjustment complexity is added as each level of the supply chain contracts with the level above it and not with the top-level OEM. Responsibility and information visibility is thus commonly diffused down the chain, rather than integrated across the tiers within the chain (Yoon et al., 2020).
The success of the whole supply chain depends upon collaboration throughout the supply chain, a collaboration that needs to include both hard information and informal cooperation and collaboration (Lu & Shang, 2017). This in turn leads to a trade-off between the amount of inventory held within the supply chain and the number of suppliers (DeCampos et al., 2022). Adjustment complexity and associated adjustment risks are increased by the high level of supplier commonality between competitors. For example, Dell and Lenovo share 2,272 suppliers representing 48% of Dells Supplier base and 57% of Lenovo’s supplier base, meaning failure in one supplier or group of suppliers will impact both competitors who collectively have global revenues of around US$141 billion (Lund et al., 2020).
Some likely challenges are as follows:-
- The need to locate buffer inventories near to final customer demand without unacceptable increases in overall supply chain costs ties up unnecessary additional working capital. Increased costs and working capital inevitably feed through into higher customer prices or reduced supplier margins. At an individual firm level, increased working capital requirement impacts the “Return on Capital Employed” ratio and depending upon the financing strategy used, firm level leverage (in the event of more debt) or firm level return on equity (in the event of more equity), or possibly both. These all have a negative impact upon firm level valuations, thereby encouraging managements to look for alternatives, namely, to move to local or more hybrid sourcing.
- Even if safety stocks are located nearer the end customer, the complex interrelation of suppliers can mean that the failure of one supplier in a network can lead to crisis in the whole chain. In the same way that Space Shuttle Challenger had a catastrophic failure because of the failure of just one component – the “O” ring, supply chains are only as resilient as their most critical component. In a supply chain the identity of this component changes according to the stresses faced by each individual supplier.
Whatever way is used to reconfigure supply chains, the need to maintain and accelerate cross supply chain innovation rates will be essential to drive long term competitiveness.
The Multi-Layered Cluster Approach
Conventional Supply Chain Configuration
In addressing these challenges we propose that a multi-layered cluster approach be adopted to address the setting and identified challenges.
Conventional supply chain engineering has looked to establish end to end integration via single or multiple “Enterprise Requirements Planning” systems aimed at provisioning adequate inventory (according to lead times and safety stock) throughout the supply chain (Zhao & Tu, 2021). Chart 3 below shows this conventional configuration, with planning demands routed downwards through the supply tiers and product supply sent in return. The process is enhanced through end to end information availability on inventories and consumption rates labelled as “Autonomous Supply Chain Planning.
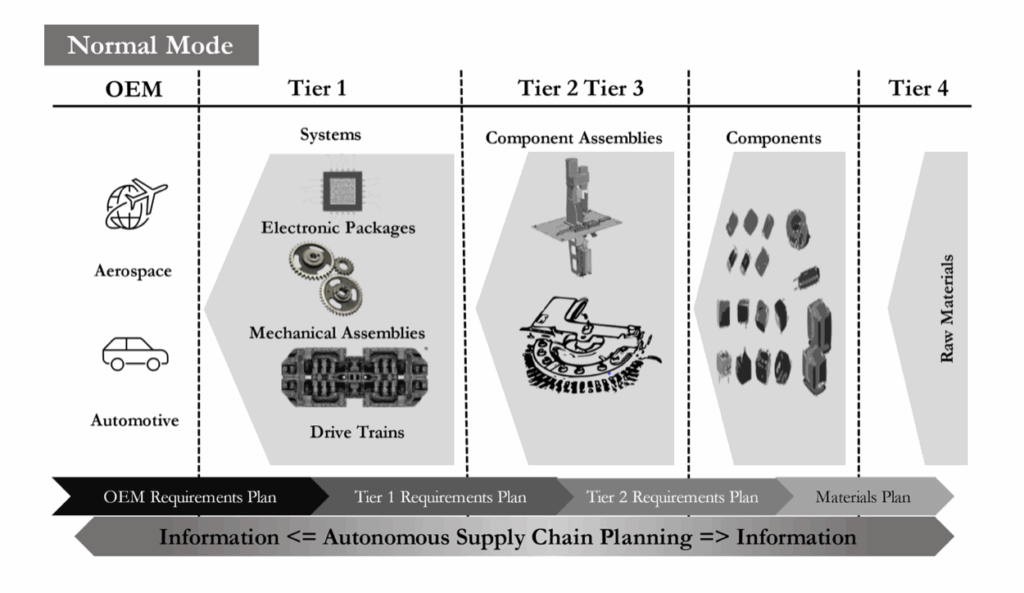
Chart 3 Conventional Supply Chain Flow
Events such as the Pandemic, Suez Canal blockage and UkrainianWar represent sudden and unpredicted exogenous constraints to the supply chain thereby invalidating elements in the original supply planning assumptions. In such an exogenously constrained supply chain, the procurement plan will, by definition, fail to deliver in some areas as the exogenous constraint acts as a “Black Swan” (Taleb, 2007) that breaks the statistical planning construct. Specifically, such an event generates a “systemic supply chain failure” as parameters such as safety stock, lead time and procurement lot size, are unable to act as buffers to stop disruption for ongoing product families. More normally these combine to insulate against “noise” within the forecasting process, which itself is constantly adapting based upon monthly updates to a rolling forecast, in many cases augmented by access to end customer “sell-out” information.
Ongoing Strategic Adjustment
As with all “crisis” events, the events between 2020 to 2022 seem to be accelerating moves towards a “new normal” with supply chains facing increasingly regionalised political and regulatory landscapes. This is not an end to globalisation, but a shift in how globalisation operates to reflect an increasingly multi-polar world that will be more exposed to shocks for two reasons.
First, establishing a new global political balance will take time and may involve both the restructuring of the global financial system (Zhang, 2021) and either direct or proxy conflict (Allison, 2015) should the USA and China become embroiled in a “Thucydides Trap”. Second, extreme climate events, that have the ability to disrupt economies, such as floods, fires, hurricanes and tornadoes seem to be occurring with accelerating frequency (Diffenbaugh, 2020).
Short term, initially at a firm level there is an imperative to develop an allocation mechanism that works in conjunction with the Supply Chain Enterprise Resource management system, to drive available inventory to its most needed application (Shailaja et al, 2021). Longer term a combination of changes in technology and logistics flows are required to re-configure their supply chains so that more activities are brought closer to their markets.
Allocation To Mitigate Short Term Disruption
Allocation in response to the perceived need is often undertaken in shortage situations by suppliers and used to replace alternatives such as “First In First Out” order allocation or “Order Due Date” prioritisation. Under such an allocation model, a product planner(s) acts as a human interface between the major customers and the allocation of inventory. Using data derived that combines end customer inventory holdings and sell out rates, the planner is able to anticipate shortages and negotiate the reallocation of shipments across the supply chain to optimise end customer delivery performance measured by both order fill and order line fill metrics. This manual allocation process is already sometimes used during the launch phases of “blockbuster products” where initial production volumes cannot match market demands. The process requires “thick trust” across the supply chain from the product planner undertaking the allocation through to the end customer with a stress on mutual collaboration and shared goals and interests.
The process is usually only sustainable to cover a limited number of shortage products, given the high human resource commitment required to “negotiate” allocations across the supply chain. At a firm level further complexity arises as many Enterprise Resource Planning systems are implemented under the specific assumption that allocation will not be required, so there is a “knock on” management requirement to make sure that enterprise resource planning consequences are understood when the allocations are made.
Supply Chain Re-Configuration
A more generalised approach to coping with the interruptions and technical change the global economy is facing, is to rethink supply chain dynamics. Some firms are looking to move activities closer to their customers (Lund et al., 2020), which will not always be feasible. Firm level relocation is constrained by the degree of existing relationships, the need to maintain low-cost profiles and resilience (Kersan‐Škabić, 2022; 2021). In such decisions there will be a firm level desire to maintain stability, cost profile and maintain resilience. Equally some are either / also appraising safety stock inventory holdings and order batch sizes. One example can be seen in how the automotive industry is needing to move from “just in time” ordering of custom integrated circuits towards bulk ordering (Sigal, 2021).
Clusters As Stress Mitigators
Clusters have a potentially significant role to play in addressing these challenges.
Since Porter (1990) identified the crucial role of clusters in the early 1990’s as loci of expertise, synergy and growth, much work has looked at these in the context of building skills, innovation and interfirm resilience (Ikram et al., 2018). Clusters, be they the automotive cluster in Baden-Württemberg in Germany or a textile cluster in China help firms develop skills, raise innovation and build resilience via interfirm dependency. Clustering also offers the opportunity for collaborative working between firms to provide contingency arrangements in the event of an external disruptive event. Although firms within a cluster are intensely competitive, they also need to offer Multinational Firms security of supply, even in the face of extreme disruption such as a Pandemic or severe climate event. Clusters or rather “rethought” clusters can help deliver this.
It is already likely that cluster firms will in many cases be “loosely” collaborating to support innovation. Where these clusters are suppliers to Tier 1 or OEM supply chain participants, they tend to be dominated by the strong purchaser. In such a setting, notwithstanding the post 2000 experiences of the German Automotive cluster (Buchmann & Pyka , 2015), innovation is often driven by the end customer (sometimes a Tier 1 assembler or the OEM final manufacturer) in preference to the competitive behaviours of the local cluster firms (Ding et al., 2022). Inevitably both innovation levels and profitability within the cluster have the potential to be higher when there are weak customers, rather than strong global multinationals.
Black Swan supply chain disruptions challenge this paradigm, as pooled resources are likely to offer more resilience than fragmented ones. Pooling benefits are reflected in the experience of the German Automotive cluster, where innovation rates accelerated after 2000 by enabling horizontal cross cluster small firm links rather than vertical OEM or Tier 1 controlled linkages (Buchmann & Pyka , 2015). Chart 4 below sets out a “stress mode” revised supply chain configuration in which components, subassemblies and production capacities are pooled at Supply Chain Tiers 2 and 3 to optimise customer service levels to higher tiers (OEMS and Tier 1 Systems Integrators).
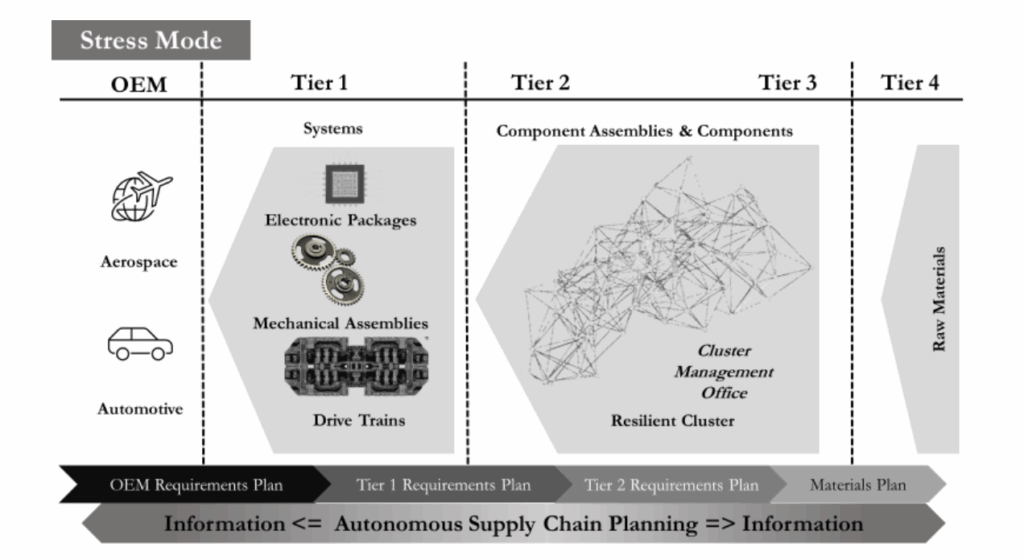
Chart 4 : Stress Mode Cluster Pooling
Under this “crisis paradigm” supply chain clusters are reorganised to permit cross cluster collaboration in the event of supply crises. In such a structure, the contractual relationship would remain with the current supplier, but other suppliers in the cluster would “back fill” shortages at the time of market stress according to a specific price and profit share agreement organised and managed by the cluster.
A theoretical construct has applied this “pooling” approach to sharing “high value limited use but critical” spare parts. Applying a “Grand Coalition” game theory construct to solve the problem suggests that pooling will benefit all participants under the following constraint. In the event of a shortage no single firm should suffer a significantly larger loss than that faced by the firm in need of the part. Specifically, the overall group of firms win in the event that, when a firm in the network supplies the only available part from its inventory to cover a shortage at another firm, provided that no other firm in the group incurs a subsequent failure that immediately needs the (now already used) part. If this occurs, the network as a whole suffers a loss greater than if the original company had been forced to wait for the new part. For example, a part that could be used on either a wide- bodied jet liner or a private plane would a priori have a much higher financial loss were it not available to repair the jet liner than if the same part was not available to repair a small private plane (Karsten & Basten, 2014). Formally this need to optimise losses across all firms can be described as the need to avoid potential asymmetric losses between pooling partners in event of common inventory or capacity shortages.
Consequent upon the need for all parties to attain benefit and minimise loss through adopting a pooled approach, although pool manager needs to be governed by a neutral institution, the decision to declare a stress event must be collaborative, involving both suppliers and customers. A key role of the “neutral facilitator” in this setting will be to nurture and build the consensus necessary for this decision.
Managing Asymmetric Loss Risks
To enable “pooling” in clusters, requires specific process design to mitigate this asymmetric loss risk. Such a design caries significant “gaming” risks, as all participants start with incentives to claim their potential risk is the greatest. For this reason, the starting point to managing these risks is to align financial, reputational and contractual imperatives across the cluster as the “crisis mode” is activated. Alignment is executed through four different initiatives, (i) the creation of “virtual firm” to pool production resources, (ii) profit pooling and associated incentives, (iii) common contractual and “customer charter” arrangements and (iv) associated operational arrangements.
The Virtual Cluster Manager
Prior to entering a crisis, a cluster will consist of supply vector α = (f1, f2, … fn) where f denotes an individual firm and n the number of firms in the cluster that interact with the customer vector β = (c1, c2, … cm) where c denotes an individual customer and m the number of customers interacting with the cluster. By definition n ≠ m, as ceteris paribus some customers will deal with more than one firm in the same cluster (and visa-versa) and may source the same part from different firms at different prices, payment terms and under delivery conditions. Each firm f has its own cost profile and earns its own unique net operating profit (perfect competition does not exist so each firm’s cost and margin profile is different).
Cluster pooling changes the supply side of this relationship, so that although from the customer’s perspective, the customer is still dealing with its individual counterparty firm f, behind this, orchestration of the supply is established by a single cluster entity X that consolidates the product supply resources accorded to the firms in vector α as a single “virtual” supply entity. The original contractual obligations for each customer Cn remain with their original respective firm fn. “Virtual” super-firm X has taken control of the Master Production Schedule and associated parts and sub assembly provisioning, thereby ensuring every available piece of inventory and capacity is optimally utilised to satisfy customer orders.
To ensure that super-firm X is firmly rooted in the competitive needs of all the firms in the cluster (α), its operating staff are “co-opted” from cluster firms on a short term basis. By relying upon short term “secondment” this model emulates the existing highly successful Darpa programme management structure (Walker et al., 2016) whilst ensuring all cluster wide decisions are tightly integrated into individual firm level needs.
Super-firm X’s role is to consolidate component and subassembly inventories across all cluster firms f1 ….fn and allocate these into a master production schedule across all firms, so that component and sub assembly stocks together with production capacity are optimised across the cluster in terms to satisfy customer demand. The consolidation (centralization) of the available component inventory a priori leads to service level benefits (Eppen, 1979) as inventory consolidation improves overall availability. The “stress” situation assures optimal conditions for inventory pooling as the product range is neither restricted nor has high demand variability (Kim & Benjaafar, 2002) nor restricted by “thick demand tail” profile (Bimpikis & Markakis, 2016).
Specifically, cluster entity X has the relationship that X[MPS] = ![]() (where MPS is the Master Production Schedule and D is the consolidated individual firm level demand) that is derived by accumulating product demand across all member firms of the cluster for products that are declared as “in crisis”. The relationship of the cluster management firm X is “virtual” as production is undertaken by individual firms in vector α and customer order shipment is made against the original customer orders (so ceteris paribus) no order terms are changed.
(where MPS is the Master Production Schedule and D is the consolidated individual firm level demand) that is derived by accumulating product demand across all member firms of the cluster for products that are declared as “in crisis”. The relationship of the cluster management firm X is “virtual” as production is undertaken by individual firms in vector α and customer order shipment is made against the original customer orders (so ceteris paribus) no order terms are changed.
Profit Pooling
Successful cluster pooling requires the alignment of profit incentives. For one firm to release its capacity and safety stock to satisfy orders upon on another requires that neither firm perceives this as a “losing” situation, that the end outcome be “stable”, that all participants believe that their individual benefit outweighs the “anarchy” risk if they do not participate and that the overall cooperation agreement enables similar risk profiles between pooling participants (Nagarajan & Sošić, 2008).
The cluster entity X must establish arrangements that give all cluster participants assurance of stability, fairness and solidity. To achieve this objective, it is essential that the cluster manager X can assure all participating firms in the “crisis” reconfiguration of the following:-
- Their basic operating costs will be met for the duration of the crisis, with such operating costs being defined as covering their loan interest and repayments plus lease payments as well as more normal labour costs ? and overheads
- A profit allocation partly related to the sales price the firm f achieved on its pre-crisis order book
- A profit allocation partly related to attaining production targets set by the cluster manager X
To enable the above, all revenues are credited to a pooled account operated by the Cluster Manager X, that then disburses the funds based upon the above rules. To give certainty to all supply chain players this account needs to be underpinned by a state guarantee (or failing this by a customer bond that hold a minimum AA rating). With this state guarantee in place their commercial lenders can use it to substitute the firm level debt risk weights in their regulatory risk assessments, thereby assuring the stability of both firm credit financing and lender balance sheets.
Contractual and Compliance Issues
Pooling both capacity and componentry will require pre-agreed contractual arrangements between both cluster members and between cluster members and customers. Within the cluster the legal agreements will need to agree the status of the Cluster Manager and how it is funded in normal times, the arrangements for declaring a crisis and the actions to be executed during a crisis to share profits, temporarily transfer staff into the cluster manager to boost it capabilities, plus share information, data, component and assembly stocks and patents.
Agreements will also be required with customers to allow for the pooling arrangements to occur, and most especially to (i) allow for rapid qualification of substitute production facilities into customer quality systems, (ii) provide access to patents and proprietary technology, (iii) establish customer crisis interface teams to help manage the supply allocation process.
Operational Issues
All contingency arrangements require well thought through operating plans that are implemented into pre-prepared operating procedures and software systems. Some key requirements are outlined below
- The anchor institution that will host the virtual cluster manager entity needs to be named and carry a skeleton staff responsible for updating, testing and rehearsing the contingency plans and software. Given the alignment of cluster innovation networks to cluster supply chain networks, an entity located within an existing local university could offer the optimal connectivity and trust.
- Clear procedures are required to declare a “stress event”, and these protocols must include buy in from both suppliers and customers (all participants in vectors α and β).
- Both the skeleton and full stress situation team must rotated in and out of cluster firms on a regular basis so that there is a “natural trust” between firms and the cluster manager. During a stress event, previous team members are immediately transferred into the cluster manager from their host firms thereby bonding member firm organisations into the cluster manager.
- An inventory and orders observatory must be in permanent existence so the information framework to drive “stress mode” exists, is tested, trusted and in operation. This observatory gives visibility to components and sub-assemblies identified by a universal cluster part number, along with part number consolidated demands from cluster firm Enterprise Planning Systems.
- The systems and procedures will be regularly used to benefit cluster firms where there is a limited one-off shortage of a component or raw material thereby assuring all participants are familiar with both the procedures and the benefits of pooling.
- A customer liaison function will be created to work with end customer supply chain managers to drive integrated contingency planning
- Linked to the customer liaison function, an “allocation” function that works with all customers to prioritise shipments according to customer circumstances (for example: if the cluster is supplying the automotive industry, the key metric during a period of supply stress will be to ensure product supply to maintain OEM production line output).
- This manual allocation process optimises overall inventory allocation. It is embedded into firm level systems so that they recognize the allocation decisions in the resulting inventory and resource plan.
- The development of contingency “3D Printing” capability will occur near major customers to print limited numbers of critical parts in the event of supply chain rupture
- The review, development and implementation of “boiler plate” language for firm level and customer level loan and bond covenant wording to ensure that firm level financing is not disturbed by the adoption of the “stress” operating mode.
- Map the supply chain relationships within the local existing cluster to establish cluster capabilities and overtime enable tactical investments to improve local supply resilience (Culkin, Davies & Simmons, 2020).
The Entrepreneurial University As The Enabler
In stress mode the cluster manager coordinates manufacturing capacity across firms in the cluster to ensure key customer demands are met according to allocations agreed with customers. Such an approach would require similar institutional coordination to existing structures that are utilized to aid innovation (Gorzelany-Dziadkowiecet al.. 2019).
Institutional coordination must be administered by a neutral but regionally embedded organisation, for this we suggest the “Entrepreneurial University”. In such a conception, the Entrepreneurial University (which has no commercial interest in any of the supply contracts and is therefore “neutral”) would act as an “anchor institution” within the region that helps to promote innovation and economic development (Culkin, 2015).
The specific role of the “anchor institution” would in normal times include providing a safe space for firms to network with each other to help build trust and idea sharing to raise innovation rates and work force skills. This rising level of innovation integrates with the university’s own and its networked technical research capabilities plus its role in fostering local skills development. As preparation for times of stress and crisis, the university would act as the coordinating and technical partner of the business community to map supply relationships within the region, and to identify “anchor firms” within the region and their relationships.
With established supply maps and pre-established relationships being fostered by a trusted local anchor institution, in times of stress a cluster product planning function can be rapidly added to allow the cluster to maintain its global supply performance by sharing its production capabilities and output to maintain uninterrupted supply to critical customers.
Conclusion
This paper has been an introduction to “rethinking” supply chain design to deal with Black Swan events and extreme supply chain stress. Much has been discussed and written about “reshoring” or raising supply chain inventory levels to cope with supply chain stresses. Notwithstanding, such “reshoring” approaches risk (i) damaging pre-existing innovation dynamics embedded in existing clusters and, (ii) increasing firm level costs by increasing inventory holdings, without assuring that such increases in inventory will avoid disruption.
Our proposal looks to us the inherent strengths of clusters to combine the existing supply chain strengths within a redesigned management structure that cuts in during periods of stress. This revised structure is rooted in maintaining cluster (and therefore individual firm) competitiveness as it drives cooperation and inventory and capacity pooling to minimise supply chain disruption in the face of unexpected events. The framework offers benefits to both customers and suppliers, not least as both are involved in the declaration of a “stress event”, so they are bonded together to deliver the optimal customer experience through the challenge. This is a key non – price competitive weapon for all firms in the cluster, helping them to differentiate themselves over competing suppliers and driving long term customer stability.
By driving this mechanism through “borrowing” firm level staff and using it to constantly handle minor supply chain stresses and mismatches, the mechanism is constantly evolving and constantly being prepared to handle large systemic events. Integrating cluster “super-firm” functions with member firms via the co-opting of staff, and embedding firm level management within the governance of a neutral institution such as an entrepreneurial university enhances “thick trust” between firms.
In consequence, with such an approach, for the cluster as a whole, preparing for supply chain stress becomes just one more benefit from building cluster-thick trust to enhance continual innovation and improvement.
Bibliography
Andrews, D., P. Gal and W. Witheridge (2018), “A genie in a bottle?: Globalisation, competition and inflation”, OECD Economics Department Working Papers, No. 1462, OECD Publishing, Paris, https://doi.org/10.1787/deda7e54-en.
Agnew, H. (2022) Investors Bet Ukraine War Will Prompt Companies To Bring Production Onshore, Financial Times: London, 26 March 2022, Available at : https://www.ft.com/content/07faf1be-88a5-4133-92c5-c38f117692e6 , Accessed 26 March 2022
Allison, G. (2015). The Thucydides Trap: Are The US And China Headed For War?. The Atlantic: Washington DC, September 24 2015. 24(9), 2015.
Bimpikis, K., & Markakis, M. G. (2016). Inventory pooling under heavy-tailed demand. Management Science, 62(6), 1800-1813.
Bughin, J., Lund, S., & Manyika, J. (2016). Five priorities for competing in an era of digital globalization. McKinsey Quarterly, 2, 55-61.
Buchmann, T., & Pyka, A. (2015). The evolution of innovation networks: the case of a publicly funded German automotive network. Economics of Innovation and New Technology, 24(1-2), 114-139.
Cavallo, A., & Kryvtsov, O. (2022). What can stockouts tell us about inflation? evidence from online micro data (No. w29209). National Bureau of Economic Research, Available at https://www.nber.org/system/files/working_papers/w29209/w29209.pdf , Accessed 19 April 2022
Culkin, N., Davies, V., & Simmons, R. (2020). Local Economic Zones For Economic Development. Available at http://journals.mountaintopuniversity.edu.ng/Economics/Post%20Covid%20Local%20economic%20zones%20for%20economic%20development%20Version2.pdf , Accessed 26 March 2022
Culkin, N. (2016). Anchor Institutions and Regional Innovation Systems for supporting micro and small businesses. e-Organisations and People.
Davy, J. (2021) UK Meat Industry Warns Of Imminent Supply Threat From CO2 Crisis, Reuters: London, 20 September 2021, Available at : https://www.reuters.com/world/uk/uk-meat-industry-warns-some-firms-have-just-five-days-co2-supply-2021-09-20/ , Accessed 22 March 2022
DeCampos, H. A., Rosales, C. R., & Narayanan, S. (2022). Supply chain horizontal complexity and the moderating impact of inventory turns: A study of the automotive component industry. International Journal of Production Economics, 245, 108377.
Deuber, G. (2022). Fortress Russia: Completely Lost in (Financial) Sanctions Warfare, A Deep Economic Crisis Is Unavoidable. RUSSIAN ANALYTICAL DIGEST, 21(280).
Diffenbaugh, N. S. (2020). Verification of extreme event attribution: Using out-of-sample observations to assess changes in probabilities of unprecedented events. Science advances, 6(12), eaay2368.
Ding, L., Atallah, G., & Sun, G. (2022). Global supply chain relationship, local market competition, and suppliers’ innovation in developing economies. Technological and Economic Development of Economy, 28(1), 49-75.
Ding, Q., Dong, L., & Kouvelis, P. (2007). On the integration of production and financial hedging decisions in global markets. Operations Research, 55(3), 470-489.
Domonoske, C. (2022) Automakers face even more supply chain pain as Canadian protesters block a key bridge, NPR : Washington DC, 10 Feb 2022, Available at : https://www.npr.org/2022/02/10/1079834996/automakers-workers-supply-chains-canada-protests-ambassador-bridge Accessed: 27 March 2022
Eppen, G. D. (1979). Note—effects of centralization on expected costs in a multi-location newsboy problem. Management science, 25(5), 498-501.
Fazili, S, & Harrell, P. (2021) When the Chips Are Down: Preventing and Addressing Supply Chain Disruptions, White House Briefing : Washington DC., 23 September 2021, Available at https://www.whitehouse.gov/briefing-room/blog/2021/09/23/when-the-chips-are-down-preventing-and-addressing-supply-chain-disruptions/ , Accessed 22 March 2022
Feller, B. (2008). Development of a total landed cost and risk analysis model for global strategic sourcing (Doctoral dissertation, Massachusetts Institute of Technology).
Gorzelany-Dziadkowiec, M., Gorzelany, J., Stauskis, G., Hernik, J., VAN ASSCHE, K., & Noszczyk, T. (2019). The innovation process in local development – the material, institutional, and intellectual infrastructure shaping and shaped by innovation. Technological and Economic Development of Economy, 25(6), 1232-1258. https://doi.org/10.3846/tede.2019.11094
Hill, A., Doran, D., & Stratton, R. (2012). How should you stabilise your supply chains?. International journal of production economics, 135(2), 870-881.
Ikram, A., Su, Q., Fiaz, M., & Rehman, R. U. (2018). Cluster strategy and supply chain management: The road to competitiveness for emerging economies. Benchmarking: An International Journal.
Imamkulieva, E., & Kondakova, K. (2022). International cargo transportation through the Suez Canal and alternative routes (by the example of China-EU). In SHS Web of Conferences (Vol. 134, p. 00135). EDP Sciences.
Jackson, J., Nelson, R., Weiss, M., Sutter, K., Schwarzenberg, A. & Sutherland, M. (2021) Global Economic Effects of COVID-19 US Congress L: Washington DC, 10 Nov 2021, Congressional Research Service R46270, Available at : https://sgp.fas.org/crs/row/R46270.pdf, Accessed 12 April 2022
Karsten, F., & Basten, R. J. (2014). Pooling of spare parts between multiple users: How to share the benefits?. European journal of operational research, 233(1), 94-104.
Kersan‐Škabić, I. (2022;2021;). The COVID‐19 pandemic and the internationalization of production: A review of the literature. Development Policy Review, 40(2), n/a. https://doi.org/10.1111/dpr.12560
Kidd, M. (2019) Social Network Analysis of DoD Supply Chain Vulnerabilities, Small Wars Journal 10 May 2019, Small Wars Foundation, Maclean : Virginia, Available at : https://smallwarsjournal.com/jrnl/art/social-network-analysis-dod-supply-chain-vulnerabilities, Accessed 27 April 2022
Kim, J., & Benjaafar, S. (2002). On the benefits of inventory-pooling in production-inventory systems. Manufacturing & Service Operations Management, 4(1), 12-16. https://doi.org/10.1287/msom.4.1.12.284
Kisperska-Moron, D., & Swierczek, A. (2009). The agile capabilities of Polish companies in the supply chain: An empirical study. International Journal of Production Economics, 118(1), 217-224.
Knight, F. H. (1921). Risk, uncertainty and profit (Vol. 31). Houghton Mifflin.
Komorowski, P., Warchalowski, J., & Zawada, P. (2021). The organizational culture of enterprises and changes in supply chain management in the COVID-19 pandemic era. Journal of Modern Science, 47(2), 211-226. https://doi.org/10.13166/jms/144166
Kozul-Wright, R., & Rayment, P. B. W. (2004). Globalization reloaded: An UNCTAD perspective. United Nations Conference on Trade and Development, UNCTAD Discussion Paper 167, UNCTAD : Geneva, Available at : https://unctad.org/system/files/official-document/osgdp20041_en.pdf
Kumar, K., Boesso, G., Favotto, F., & Menini, A. (2012). Strategic orientation, innovation patterns and performances of SMEs and large companies. Journal of Small Business and Enterprise Development, Vol. 19 No. 1, 2012 pp. 132-145, Emerald Publishing : UK
Love, J. H., & Roper, S. (2015). SME Innovation, Exporting And Growth: A Review Of Existing Evidence. International Small Business Journal, 33(1), 28-48.
Lu, G., & Shang, G. (2017). Impact of supply base structural complexity on financial performance: Roles of visible and not-so-visible characteristics. Journal of Operations Management, 53, 23-44.
Lund, S., Manyika, J., Woetzel, J., Barriball, E., & Krishnan, M. (2020). Risk, resilience, and rebalancing in global value chains, McKinsey Global Institute : San Francisco, August 6 2020, Available at : https://www.mckinsey.com/business-functions/operations/our-insights/risk-resilience-and-rebalancing-in-global-value-chains Accessed 26 March 2022
Marsden (2017) Black swans, or the limits of statistical modelling. Risk-Engineering.org : Paris , Available at : https://risk-engineering.org/static/PDF/slides-black-swans.pdf, Accessed 31 March 2022
Min, S., Zacharia, Z. G., & Smith, C. D. (2019). Defining supply chain management: in the past, present, and future. Journal of Business Logistics, 40(1), 44-55.
Nagarajan, M., & Sošić, G. (2008). Game-theoretic analysis of cooperation among supply chain agents: Review and extensions. European journal of operational research, 187(3), 719-745.
Oxford Analytica (2022), “Freight rates will normalise higher than pre-pandemic”, Expert Briefings, Emerald Insight : Bingley, UK, available at https://www-emerald-com.ezproxy.herts.ac.uk/insight/content/doi/10.1108/OXAN-DB266889/full/html Accessed 26 March 2022 https://doi-org.ezproxy.herts.ac.uk/10.1108/OXAN-DB266889
Park, Y. W., Amano, T., & Moon, G. (2012). Benchmarking open and cluster innovation: case of Korea. Benchmarking: An international journal Vol. 19 No. 4/5, 2012, Emerald Insight: UK.
Porter, M. E. (1990). Competitive Advantage Of Nations: Creating And Sustaining Superior Performance. Simon And Schuster : NY
Rozhkov, M., Ivanov, D., Blackhurst, J., & Nair, A. (2022). Adapting supply chain operations in anticipation of and during the COVID-19 Pandemic. Omega, 102635.
Sahin, F., Narayanan, A., & Robinson, E. P. (2013). Rolling horizon planning in supply chains: Review, implications and directions for future research. International Journal of Production Research, 51(18), 5413-5436. https://doi.org/10.1080/00207543.2013.775523
Shailaja, V. N., Kavya, J., Devatha, M., & Dinesh, S. (2021) Design Of Material Allocation Module in An ERP System for Product Industry., Bulletin Monumental Journal: Paris, Volume 22 : Issue 11 – 2021, pp 152 – 158, Available at : http://bulletinmonumental.com/gallery/17-nov2021.pdf , Accessed 26 March 2022
Sigal, P. (2021). Chip shortage could stretch for years; New sourcing needed as hopes for quick fix fade. Automotive News, 95(6981), 0008., April 12 2021 https://link.gale.com/apps/doc/A658546985/AONE?u=uniherts&sid=summon&xid=02d3e192
Taleb, N. N. (2007). Black Swans And The Domains Of Statistics. The American Statistician, 61(3), 198-200.
Tass (2022) Indonesia has no plans to join anti-Russia sanctions, says president Widodo, Tass : Moscow, 9 March 2022, Available at : https://tass.com/politics/1419293?utm_source=google.com&utm_medium=organic&utm_campaign=google.com&utm_referrer=google.com Accessed 26 March 2022
Tass (2022b) Malaysia, Vietnam oppose anti-Russian sanctions — Prime Minister, Tass : Moscow, 22 March 2022, Available at : https://tass.com/economy/1425683 Accessed 26 March 2022
U.S. Census Bureau (2022a) Total Business: Inventories to Sales Ratio [ISRATIO; BUSINV; RETAILIRSA; MNFCTRIRSA], retrieved from FRED, Federal Reserve Bank of St. Louis; Available at: https://fred.stlouisfed.org/series/ISRATIO , Accessed : April 16, 2022
U.S. Census Bureau (2022b) Advance Retail Sales: Retail Trade [RSXFS], retrieved from FRED, Federal Reserve Bank of St. Louis; Available at: https://fred.stlouisfed.org/series/RSXFS, Accessed : April 18, 2022
Walker, M., Launchbury, J., Tompkins, S., Pallota, B., Hepburn, M., & Sanchez, J. (2016). Innovation at DARPA. Defense Advanced Research Projects Agency Arlington United States, Available at https://apps.dtic.mil/sti/pdfs/AD1014112.pdf. Accessed 28 March 2022.
White House (2022) FACT SHEET: United States and Allies and Partners Impose Additional Costs on Russia, White House Briefing: Washington DC, 24 March 2022, Available at : https://www.whitehouse.gov/briefing-room/statements-releases/2022/03/24/fact-sheet-united-states-and-allies-and-partners-impose-additional-costs-on-russia/ Accessed 26 March 2022
Yoon, J., Talluri, S., & Rosales, C. (2020). Procurement decisions and information sharing under multi-tier disruption risk in a supply chain. International Journal of Production Research, 58(5), 1362-1383. https://doi.org/10.1080/00207543.2019.1634296
Zhang, F. (2021). Power Contention And International Insecurity: A Thucydides Trap In China-US Financial Relations? The Journal of Contemporary China, 30(131), 751-768. https://doi.org/10.1080/10670564.2021.1889229
Zhao, B., & Tu, C. (2021). Research and development of inventory management and human resource management in ERP. Wireless Communications and Mobile Computing, 2021.


